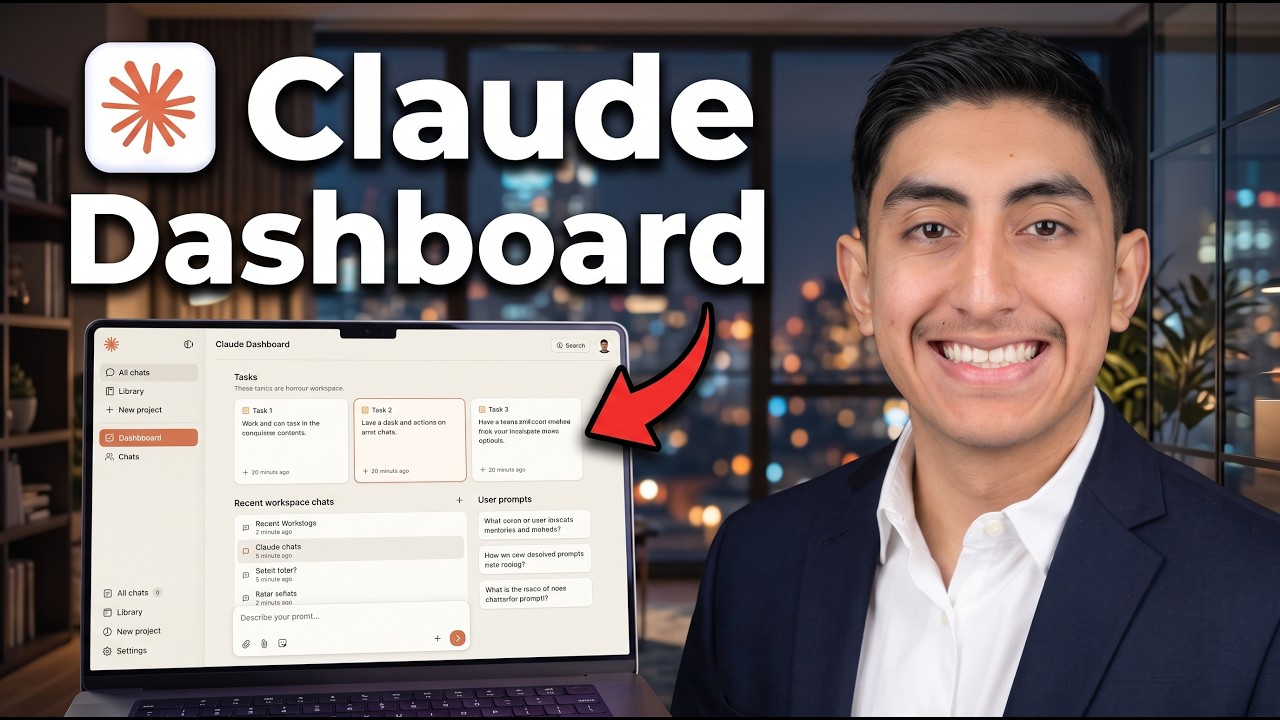
TL;DR: On October 8, 2026, Anthropic shipped Claude Dashboards in beta for Pro, Max, Team and Enterprise plans. You ask a question about your data, Claude writes the query or calculation behind every chart, runs it, and lays out the dashboard. In this guide I build one from a CSV, make it live with a file in Google Drive (revenue went from $218.5K to $259.5K on refresh), check the formula behind a number, edit it by asking, and connect BigQuery's free sandbox. Then the catches, because there are a few.
Table of Contents
- What Claude Dashboards Is
- Step 1 Check Your Plan and Turn On Code Execution
- Step 2 Build Your First Dashboard From a File
- Step 3 Make It Live With Google Drive
- Step 4 Check Every Number in the Sources Panel
- Step 5 Edit It by Asking in Plain English
- Step 6 Connect BigQuery for Free
- Step 7 Share and Export
- Limits and Catches
- My Take
- Frequently Asked Questions (FAQ)
🎬 Watch the full walkthrough on YouTube → https://youtu.be/n57IpSe8jeY
What Claude Dashboards Is
Anthropic announced it on October 8, 2026, in Build live dashboards and animate explainers with Claude. You connect your data, ask a question in plain language, and Claude builds the dashboard.
This is not the same as asking for a chart in chat:
- A chat chart is a picture of data that Claude read one time.
- A dashboard stays connected to the source. It shows how each number is calculated, and it shows when its data was last refreshed.
Anthropic's getting started guide says dashboards "are made for quick, exploratory questions, like how this week's signups compare with last month's." For deep analysis, you send the dashboard to a BI tool (more on that in Step 7).
A quick note: Anthropic launched Claude Motion the same day, for animated explainers. Right now Motion is Team and Enterprise only. Dashboards works on Pro and Max too, so that is the one most of you can use today.
If you are new to Claude in general, start with my Claude AI full course for beginners.
Step 1 Check Your Plan and Turn On Code Execution
Pro, Max, Team and Enterprise all get Claude Dashboards. Free does not. On Enterprise, it is off by default until an owner turns it on in Organization settings > Artifacts.
Then go to Settings > Capabilities and make sure Cloud code execution and file creation is on. Dashboards run code, so they need it.
Dashboards count toward your plan's normal usage limits, like the rest of your work with Claude.
Step 2 Build Your First Dashboard From a File
- In the sidebar, next to Artifacts, click the + and pick Dashboard (it shows a Beta label). You get an empty dashboard with Claude on the side.
- Attach your file with + > Upload or add files > Upload from computer.
- Write the prompt.
My data is a made up coffee shop: three stores and 13 weeks of sales. Anthropic's own tip is to say what you want to learn (not only the chart) and where the data lives. I also say who is going to look at it. So my prompt has three parts:
- Who is looking at the dashboard.
- The main question it has to answer.
- The metrics I want to see.
I also add one line that saves a lot of trouble later: apply every filter to the whole dashboard.
Claude plans the layout and writes the calculation behind every chart. I am in Manual mode, so before it copies my file, Claude stops and asks: "Claude wants to run a command", with Decline, Always allow and Allow once. I click Allow once.
It took about five minutes from prompt to dashboard. And it answered the question: the dashboard showed cold brew down 18%, lattes up, and the price never changed. People are switching drinks.
One catch: an attached file is a snapshot. There is no refresh button, and it will never update. So let's make it live.
Step 3 Make It Live With Google Drive
Same file, but now it sits in Google Drive.
- Turn on the Google Drive connector in Claude.
- In the prompt, name the file and tell Claude to read it every time the dashboard refreshes.
- The first time the dashboard opens, it asks for permission: "This artifact uses connectors", Google Drive, Can read and make changes. Notice that it asks for write access too. Click Continue.
Now there is a Refresh button. I added two more weeks of sales to the file in Drive, up to October 11, came back and clicked Refresh. Revenue went from $218.5K to $259.5K, and the new weeks showed up in the weekly chart, in seconds.
This is the cheapest live setup there is: a file your team already updates.
Step 4 Check Every Number in the Sources Panel
This is the feature that makes it usable at work. Every number has a receipt.
Turn on See where numbers come from at the top right. The Sources panel lists every data source behind the dashboard. Click any number and you get:
- The Formula that calculates it. With a warehouse source, this is the SQL query.
- The Result table behind it. Mine had 252 rows, and you can copy or download them.
- An Ask Claude button, to ask about that exact number.
If it is counting the wrong thing, tell Claude what to change.
Step 5 Edit It by Asking in Plain English
The filters already work across the whole page, because I asked for that in the first prompt. I pick the last four weeks, and every card changes.
Editing is just asking. I typed: add a chart of average revenue by day of the week, with weekends in a different color. About a minute later, there it was. Weekends bring in about 25% more (about $2,807 a day against about $2,240 on weekdays).
Step 6 Connect BigQuery for Free
Files are fine, but dashboards are built for warehouses: BigQuery, Snowflake, Databricks, Redshift and ClickHouse. And you can try BigQuery for free.
- Make a Google Cloud project and use the BigQuery sandbox. It needs no credit card and gives you 1 TiB of processed query data a month (about a terabyte).
- Add the connector. In Claude, go to Customize > Connectors, search for BigQuery and add Google Cloud BigQuery (made by Google). Here is the BigQuery connector page. Sign in with your Google account.
- Check the tool permissions. Every tool is set to Needs approval, and the read only tools and the write tools are listed separately.
- Point it at a public table, like Google Trends, which updates every day.
The one gotcha: even as the project owner, my first query failed with "User does not have mcp.tools.call permission". Claude's own first fix was right in the chat:
- Turn on BigQuery's MCP server for your project with one
gcloudcommand (Claude gives it to you). - Give the Google account you connected the MCP Tool User role, plus BigQuery Job User.
After that, the queries run.
Step 7 Share and Export
Dashboards start private. Click Share to see the options: invite people by email, or change general access from Only you to people you invite or anyone with the link. One rule from Anthropic's sharing help: artifacts that connect to your apps cannot use "Anyone with the link".
Export does not download a file. It sends the dashboard to a real BI tool when you need to go deeper. The list I saw included Amplitude, Datadog, Grafana Cloud, Hex, Mixpanel, Omni Analytics, Perplexity Computer, PostHog and Sigma, with monday.com marked coming soon. Anthropic's announcement also names Databricks Genie, Looker and Tableau as coming.
Limits and Catches
Before you put one of these numbers in a meeting, here are the catches:
- It is a beta. Labels can change week to week.
- No published refresh schedule. I found no setting for automatic refresh. Someone has to open the dashboard or click Refresh.
- Datasets are small, about 8 megabytes each, so aggregate your data first.
- Check your company's data rules before you connect production data.
- Open the sources and read the query or the formula. Every time.
Also note that a big dashboard uses your plan's usage limits like any other Claude work. If you want to know how much those limits are worth, read my post on how Claude is giving you 20x your money's worth.
My Take
So that is a file, a live Drive file and a real warehouse connection. The part I trust is not the charts, it is the Sources panel: every number shows its formula and its rows. That is what makes this more than a pretty picture. The weak part is refresh: there is no schedule, so a "live" dashboard is only as fresh as the last time someone clicked the button.
Frequently Asked Questions (FAQ)
Is Claude Dashboards free? No. It is in beta on the Pro, Max, Team and Enterprise plans. The BigQuery sandbox I connect to it is free.
Can I build a dashboard from a CSV? Yes. Attach the file. But an attached file is a snapshot with no refresh button. Put the file in Google Drive to make it live.
Does the dashboard update on its own? It reads the source again when you click Refresh. I found no automatic refresh schedule.
Which data warehouses work? Anthropic names Amazon Redshift, BigQuery, ClickHouse, Databricks and Snowflake.
Why does BigQuery say I do not have mcp.tools.call permission? Turn on BigQuery's MCP server for the project, then give your Google account the MCP Tool User role and BigQuery Job User.
Can I check how a number was calculated? Yes. Turn on "See where numbers come from" and click the number. You see the formula or SQL and the result rows.
My prompt pack and the coffee shop files to follow along are in the AI Academy community on Skool, where I teach you how to master AI tools → https://www.skool.com/ai-academy-with-robby-6849/about. Watch the full video to see every step on screen.
Sources: Anthropic: Build live dashboards and animate explainers with Claude, Get started with Claude Dashboards, Google Cloud BigQuery connector, BigQuery sandbox